
Tony Manero is the president of the burgeoning vintage clothing store Disco Inferno. What started off as a passionate hobby blossomed into a national chain of second-hand clothing stores in just 10 years. A few years ago, sensing he could extend his reach, he launched Inferno’s Brickhouse.com, his online clearinghouse for secondhand clothes and other memorabilia from groovy decades past.
While always customer-focused, Inferno has grown to a point where Tony can hardly visit all his stores in a year, let alone talk to every customer. Although he tries to get out and talk with his customers, he feels increasingly isolated as the day-to-day demands of running a successful national chain make his time scarcer than The Oakridge Boys on the dance floor.
Talking to some colleagues, he decided it was time to start a Voice of the Customer program. In this way, he could get systematic feedback across his different channels – from retail, to online, to his call center – and that’s exactly what he did.
He worked with his team and designed and deployed short, friendly, and on-brand post-purchase surveys. In some cases, he even put a coupon for completion to double-purpose his VOC program as a retention program. When he was done, Tony had three different transactional surveys in place: retail, on-line, and call center.
One day, looking at his dashboards, he noticed something odd. All of his Key Performance Indicator (KPIs) were green, but the number of customer complaints seem to be growing from his call-center metrics. More alarming, he noticed a slowdown in sales. He cracked open a fresh TaB diet cola and pondered his situation.
“This makes no sense,” he thought.
Undeterred, he started reading the comments in the retail survey. The problems seemed to be all over the map. Some were about rude staff, others about return policies, still others about damaged or dirty clothing. Becoming frustrated, he reached for his hand grip exerciser and starting squeezing. With his free hand, he clicked his mouse to start reading the thousands of lines of feedback from his online survey. While intriguing, he again becomes overwhelmed with the amount and variation of feedback.
What was more perplexing was what trends he could make out also seemed to involve other channels. For example, he saw one instance where there was a complaint about a customer returning platform shoes he bought online in the online survey. However, reading through the comment, it was obvious the store associate was unaware of how to handle the return when the customer showed up in a store to return his shoes due to bad fit. He sighed and stopped his handgrip exercises, throwing the device on the table. It was getting late, so he decided to quit for the day, go back to his pad, and get a good night’s sleep on his waterbed. “With a clear mind, I might be able to sort this out tomorrow morning,” he thought to himself.
Freaky Deaky
How to help Tony out? Here’s the skinny: what Tony needs is a common categorization framework. The goal of a common categorization framework is to standardize the coding of your unstructured data. Unstructured data typically consists of comments in your surveys, review sites, and other places where people talk about your products and services.
By standardizing feedback, you can look for trends, incidence levels, and sentiment without regard to origination. Common categorization frameworks have the following advantages over stand-alone “tags” and within survey taxonomy coding approaches:
- It standardizes unstructured feedback so that it is analyzable at scale
The most basic advantage for common categorization is data reduction. Most people cannot wrap their brains around thousands of comments to discern any patterns. While it is great to be close to your customers and read everything they write, it is a bit daunting to do so on an ongoing basis when responses number in the hundreds or thousands.
- It Is Channel Agnostic
Rather than just understanding what is going on by siloed channels, you can understand the customer from their perspective. It reduces the need to be a CX detective since the evidence are rolled up by issue rather than by functional area, although you can still refer to the channel (or channels) affected.
- It allows to for multiple levels of specificity
Good code structures can allow to change up or down in terms of specificity. For example, in Tony’s case you might have a code called “returns”. You could then reference all comments that were coded as “returns” and look at trends for across Inferno as a whole. Alternatively, you could look at “returns > disco balls > damaged > chain” and be able to look at the incidence of that specific product, service, or for the entire enterprise, by certain customers, and so forth.
- Backcasting
Say Tony starts carrying new type of wool afghan throw blanket at Inferno. He realizes a few months later that his clientele might not be as familiar with the care and cleaning of wool products which is very different from his usual inventory of velour, nylon, polyester, and suede products. Tony simply adds into his taxonomy and can backcast any issues that might have happened in months since launch regarding his afghan rug customers. Likewise, as new expectations or technologies emerge, he can add those new categories too, and then project it to the past.
Coding and Emotions
Categorization frameworks usually have two features: coding and sentiment. Coding is applying numerical values to an aspect of the business such as “service”, “fees”, or ‘delivery”. Coding is the ‘what’. Sentiment is typically the ‘good-bad’ continuum of affect. For example, if a customer is unhappy or happy this can be determined through sentiment coding.
While the continuum for sentiment coding is usually based on a bi-polar affect (like-dislike), other methods look at a more holistic emotional framework to code comments. One such framework is the PAD framework, which was originally pioneered through research by Mehrabian and Russell. In this framework, rather than one dimension, you have three: pleasure (affect), arousal, and dominance (or control). Pleasure is essentially affect (like/dislike) whereas arousal is the activeness of the emotion. Dominance (or control) has to do with how much control the customer feels they have.
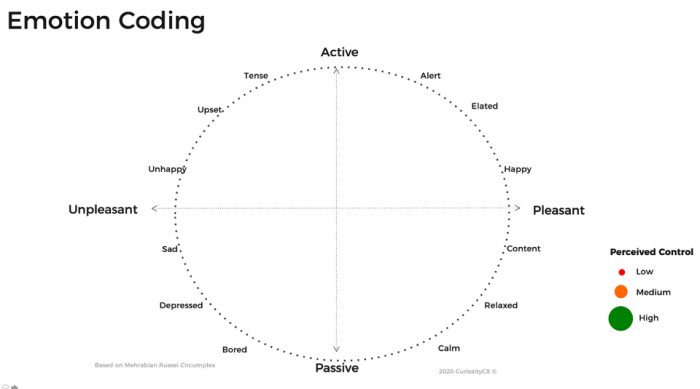
These can be arranged in three dimensions. Typically, the first two dimensions are most informative (arousal and affect). Someone can be elated (active, pleasant), depressed (unpleasant, passive), angry (active, unpleasant), or satisfied (passive, pleasant). Consumer behavior might be different considering these different emotional states.
Developing a Common Coding Taxonomy
Assuming the upfront work, including journey mapping and appropriate listening posts, has been implemented, the next step is to develop the coding taxonomy. In days of old, this was done manually. We would collect a large number of comments and then code them into a hierarchy. With advent of new technology, there is already some really good independent text analytic engines (Lexalytics, Clarabridge, Megaputer, SAS are just a few). While these new technologies help tremendously in automating coding, they need to be properly configured and trained to be of any use. Here are the generic steps in setting up your common category framework
Step 1: Standardization of Terms
Like painting a house, the first step in creating a taxonomy is prepping the data. This involves standardizing terms. First, just simple spelling corrections are needed; it is unbelievable the number of ways people can spell ‘license’ or ‘knowledgeable’. If these are not corrected, you will have a mess on your hand. Secondly, standardizing acronym and short-cuts such as “mgr” for manager and “act” for account. This terminology tends to vary by industry, so many CX providers already have CX standards for different industries to give you a bit of a head start.
Step 2: Developing a Taxonomy
The next step is developing an initial taxonomy. Certain text analytic engines offer “trending words or phrases,” but they are limited to just that. A taxonomy is a framework that is fixed over a period of time so you can monitor changes in incidence and intensity (sentiment). The best way to set up your initial taxonomy is, of course, with data.
To help Tony, we would grab a cross-section of Inferno’s voice of the customer verbatims and go to work with text analytics. As mentioned, many CX providers have industry “head starts” that you can use, but it is always wise to develop yours organically as well. Afterall, Inferno is completely different from other retailers and even different from other clothing stores, so some tweaking is required.
The output from text analytics often looks something like the illustration below. This is just a sample of the suggested coding structure around “return”. The links indicate common associations (or co-occurrences). The more co-occurrences, the closer they are together. In this way, you have the data drive your coding structure rather than imposing a structure arbitrarily. You can see clearly that too small belongs to size and size belong to returns.
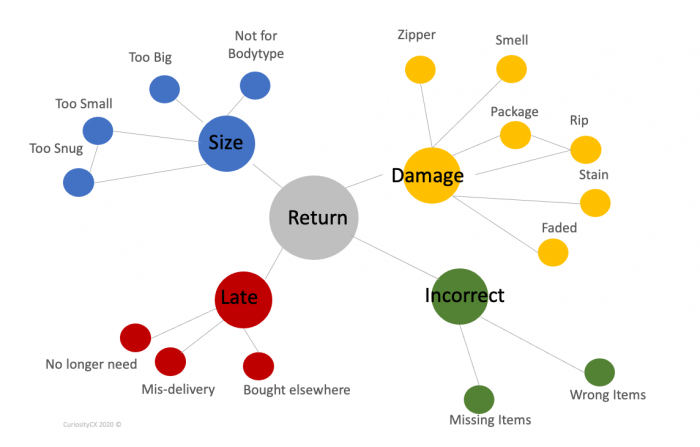
This is stage is not done automatically by the machine, though; it requires the involvement of analysts and business owners working together iteratively to refine the code to get one that is both actionable and consistently repeatable (i.e., reliable). In the end, this approach results in data that is more consistent with Tony’s customers’ ways of viewing the world and is much more accurate and consistent than machine coding. Better, in fact, than what human coders could do. Far out.
Step 3: Implementing Automated Coding
With your coding in hand you are now ready to apply it to your database. As mentioned, these coding structures are typically hierarchical in nature with some coding taxonomies. Most coding structures have at least 3 levels, with some having eight or more. Those are usually very technical coding structures such as quality studies with highly technical products.
Once the data is coded, you can also do some really helpful analyses. For example, driver analysis is common in customer experience to understand what aspects are more (and less) important to customers. This can also be applied to coded text, where the codes are the predictors and the dependent variable (what you are predicting) can be something like NPS, retention, or some other important business metric.
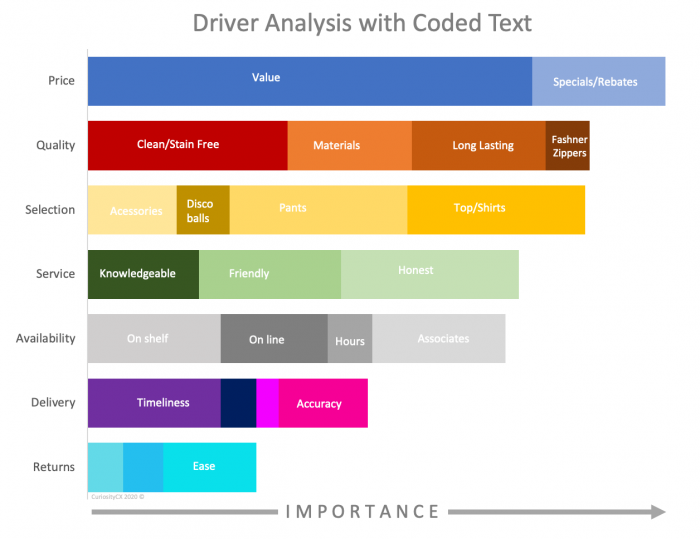
You can see here from Inferno’s results that price is the most important, followed by quality, and selection. We can also see the subcodes’ relative impacts within category. For example, “clean/stain free” is a big part of quality and is a bigger driver than even rebates in the pricing category. You can also slice and dice this for sentiment and by channel, or even geography. In this way you don’t have to go the retail survey and then the web survey and other sources to get a picture of what is going on. It’s all together. Also, once trained, well design taxonomies can be coded consistently and fast. Best of all, once implemented, they are fairly inexpensive to maintain.
Step 4: Revisiting and Updating the Taxonomy
Once your taxonomy is rolling, you should revisit Step 2 from time to time. How often? Well, of course it depends, but, usually every few years, unless you are in a rapidly changing industry – then once a year or even more frequently. The hard work of building a common categorization frame is the initial set up. Updating and running the program is a relatively small investment.
A Move Toward Unstructured
The world of CX has slowly been moving toward unstructured data for a few reasons. First, it is easier for customers to just say what they want and put the burden on codifying that information on the analysts. That means more people responding and better-quality data. Secondly, computer power and sophistication in text analytics methods have matured to the point where they are reliable, inexpensive, and produce high-quality results. Do we ditch structured questions? Nope. They still have a place in our VOC programs, but text continues to take a stronger and stronger role in providing insight to businesses and CX professionals. We know Tony is digging it. Peace out. Catch you on the flip side.
Authors note: In writing this article I am indebted to the brilliant dance moves and expertise of Brion Scheidel of InMoment, Mike House, formerly of Maritz Research, and Randy Brandt of Northern Kentucky University for sharing their thoughts and giving me the skinny on this topic with me over the years.